The lithium battery discharge curve graphically depicts how the battery’s terminal voltage changes with the discharged capacity (or time) under specific load conditions. Understanding and analyzing this curve can reveal key insights beyond simple ratings, enabling accurate performance assessments, smart design choices, and effective battery management.
Table of Contents
ToggleWhy is the lithium battery discharge curve important
Lithium batteries are everywhere, from portable electronic devices and power tools to electric vehicles and even grid energy storage systems. However, when evaluating or selecting lithium batteries, only the nominal capacity (Ah) or energy (Wh) specifications provided by the manufacturer often only provide an incomplete or even overly optimistic performance picture. The performance of batteries in real working scenarios is far more complex than a single value, which is why the analysis of lithium battery discharge curves is particularly important.
The discharge curve is a key performance graph that depicts a graphical representation of the battery’s terminal voltage as the discharge capacity (Ah), released energy (Wh) or discharge time accumulates under specific, controlled load conditions.
By deeply analyzing discharge curves, engineers, researchers, and designers can:
Accurately evaluate the effective capacity and energy that a battery can actually output at a specific operating current and temperature.
Observing the battery’s voltage stability during discharge ensures reliable operation of sensitive electronic equipment.
Provides basic data and key features for accurate State of Charge (SoC) estimation algorithms.
This provides insight into the battery’s internal resistance characteristics and its overall state of health (SoH), providing a basis for life prediction and maintenance.
Make informed decisions when selecting batteries and properly define key design parameters at the system level.
Composition of a typical battery discharge curve
The discharge curve usually presents the voltage change of the battery during the discharge process in a graphical way, which mainly consists of voltage and capacity.
Vertical axis (Y axis): expressed as battery terminal voltage (Voltage, V), reflecting the potential level of the battery output during the discharge process.
Horizontal axis (X axis): The most commonly used representation is the cumulative discharge capacity (Capacity, Ah), the amount of charge that the battery has released. Under constant current discharge conditions, the discharge time (Time, h or min) can also be used as the horizontal axis. In addition, in order to directly evaluate the energy output, the cumulative released energy (Energy, Wh) is sometimes used as the horizontal axis.
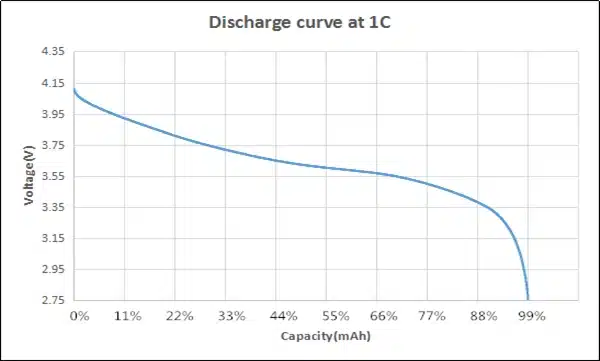
We can see that the curve shows the following typical characteristics:
- Initial voltage drop. At the moment discharge begins (i.e. when a load is applied), the battery voltage drops rapidly from its open circuit voltage (OCV). This phenomenon is called the initial voltage drop, and its magnitude directly reflects the internal impedance of the battery. The magnitude of this voltage drop is proportional to the load current and is an important preliminary indicator for evaluating the battery’s power output capability, health status, and rate performance.
- Voltage platform. Following the initial voltage drop, the voltage usually enters a relatively gentle decline area, which is the voltage platform. This is the core operating range where the battery outputs most of its energy. The flatness of the platform (i.e., the rate at which the voltage changes with capacity) is critical. A flatter platform means that the battery can provide a more stable operating voltage over a longer range of discharge depth, which is conducive to the stable operation of the load equipment.
- Inflection point. When the battery is close to exhaustion, the slope of the discharge curve will increase sharply, and the voltage will begin to drop rapidly, forming a clear turning point, which is often called the inflection point. This indicates that the available active materials in the battery are close to exhaustion, which is a key feature for judging the end of battery discharge.
- Cut-off voltage. The discharge process does not continue until the voltage reaches zero, but is forced to terminate when a preset minimum allowable voltage is reached. This voltage is the cut-off voltage. The cut-off voltage is set to protect the battery from over-discharge.
Key factors affecting discharge curve
The discharge curve of lithium-ion batteries is not static, and its specific shape and characteristic parameters are significantly affected by many factors. The following are the main factors affecting the discharge curve:
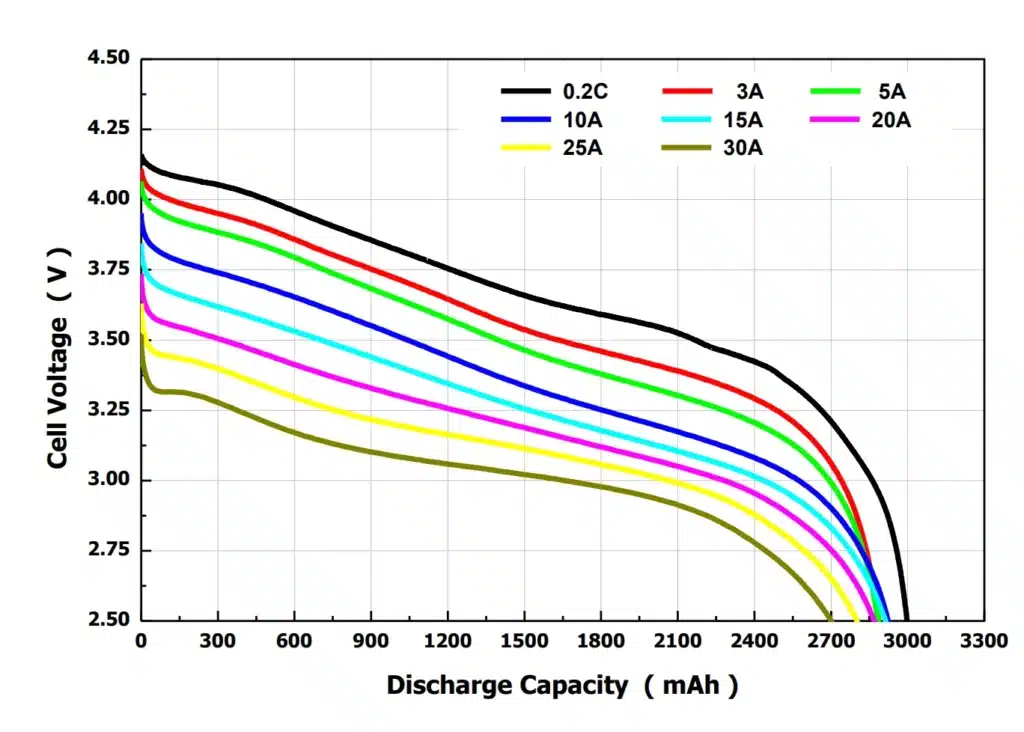
Discharge rate. Discharging at a high current usually results in a decrease in the average voltage level during the entire discharge process. The inflection point is advanced, and the area where the voltage drops rapidly is advanced. The available capacity is reduced, and the total amount of electricity that the battery can release before reaching the cut-off voltage is reduced compared to low-rate discharge.
Operating temperature. In low temperature environments, the operating voltage is significantly reduced, the available capacity is greatly reduced, and the discharge curve is significantly shortened on the capacity axis. The voltage drop may be more dramatic. In high temperature environments, the rates of all chemical reactions, including main reactions and side reactions, are accelerated. This consumes active lithium, destroys the electrode structure, and increases the interface impedance, which damages the long-term health of the battery.
Battery aging. As the battery ages, the internal resistance increases, resulting in a more significant initial voltage drop at the same discharge current. The total available capacity decreases, the voltage platform may become more tilted, and the overall curve shape tends to shrink.
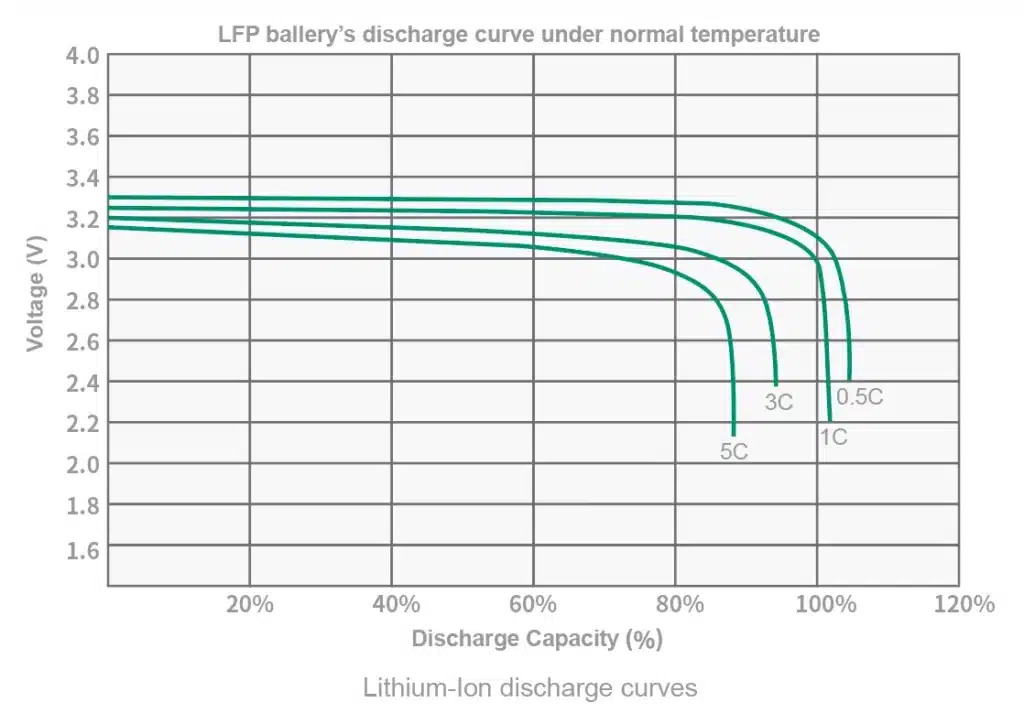
Battery chemistry system. Ternary lithium battery (NMC/NCA): usually has a higher energy density and operating voltage platform, but its voltage platform often shows a relatively obvious, continuously decreasing slope. Lithium iron phosphate battery (LFP): The most notable feature of its discharge curve is that it has an unusually flat voltage platform, but near the end of discharge, the voltage will drop very sharply and steeply.
Actual analysis obtained from the discharge curve of battery
The discharge curve of a lithium-ion battery is a graphical representation of its basic performance and contains a wealth of information. By carefully interpreting the discharge curve, you can gain practical application value in many aspects.
Calculate the actual output energy
By reading the corresponding energy from the discharge curve recorded under specific discharge conditions (specified C-rate, temperature), the total capacity or total energy that the battery can actually output under those conditions can be accurately calculated to verify whether the battery performance meets expectations.
Estimating equipment runtime
For devices with relatively stable load characteristics, the discharge curve under corresponding conditions can be used to predict the battery life. For example, in constant current discharge mode, by finding the total discharge time corresponding to the working current on the curve, the theoretical maximum operating time of the device under this current can be estimated.
Evaluate battery internal resistance
Observe the voltage drop at the beginning of the discharge curve, the drop from the open circuit voltage to the initial operating voltage. A larger initial voltage drop usually means a higher internal resistance of the battery, and analyze the overall level and slope of the voltage platform during the entire discharge process. Batteries with higher internal resistance have lower voltage under load, and the platform may drop faster.
Serves as a basis for SoC estimation
The current state of charge (SoC) is estimated by measuring the open circuit voltage (OCV) of the battery or the terminal voltage after considering the load effect, and referring to the pre-established voltage-SoC relationship curve. However, the voltage method is affected by many factors such as temperature, current, aging state, etc., and its accuracy is limited.
Auxiliary battery selection decision
Compare the discharge curves of different batteries in target application scenarios to help you choose the best battery.
Setting protection parameters
According to the inflection point where the voltage at the end of the discharge curve drops rapidly, the low-voltage cut-off value is reasonably set for the protection board.
Through in-depth analysis, you can quantify basic performance indicators and provide strong technical support and decision-making basis for equipment design, system integration, power management, battery selection and status evaluation.
How to get discharge curve for lithium ion battery
The acquisition of lithium-ion battery discharge curve relies on standardized electrochemical test methods and dedicated test equipment, and the commonly used equipment is the capacity distribution cabinet.

The method is to discharge the battery at a constant current until the battery terminal voltage reaches the preset discharge cutoff voltage (Cutoff Voltage). This is the most basic and widely used method.
During the entire discharge period, the test system will monitor and record the battery’s terminal voltage, current, discharged capacity (Ah), discharged energy (Wh), time and other key parameters in real time and continuously. By drawing a graph with the recorded voltage as the ordinate and the discharged capacity (Ah) or discharge time as the abscissa, the corresponding discharge curve can be obtained.
Conclusion
The discharge curve is a key tool for gaining insight into lithium battery performance, guiding system design and diagnosing problems; a deep understanding of how discharge rate, temperature and aging conditions shape the curve, and the significance of the characteristics of each stage of the curve, is the core of its value. You can predict the true performance of the battery under actual working conditions, thereby achieving a more optimized design and building a more reliable and durable system.